LCRA's Hydromet system uses gauges throughout the Lower Colorado River basin to supply real-time information concerning streamflow, current lake levels, recent rainfall amounts, and current temperatures throughout the basin. Use this drop down list to select the data you want to display on the map.
Sort Data By Gauge Drop Down:
Press the link to sort sites in the drop down alphabetically. The default sort is by agency name then by site number. For LCRA sites this works out to a sort of upstream to downstream. Press the 'Refresh data' link for the original sort.
Current radar:
Toggle this button to add and remove radar imagery from the map. The radar information is provided by Iowa Environmental Mesonet at Iowa State University. The radar images are updated every 5 minutes.
Start radar loop:
Toggle this button to add and remove animated radar imagery from the map. The radar information is provided by Iowa Environmental Mesonet at Iowa State University. The radar images are updated every 5 minutes.
Stream overlay:
Toggle this button to add and remove water features from the map. As you zoom in further on the map the water features become more detailed.
County boundaries:
Toggle this button to add and remove counties from the map. County boundaries are available for the entire state of Texas.
Watershed overlay:
Toggle this button to add and remove watersheds from the map. Watersheds are available for the Colorado River basin and are more detailed in and around the City of Austin.
Drought overlay:
Toggle this button to add and remove current drought information from the map. Drought information provided by the National Drought Mitigation Center (NDMC), the U.S. Department of Agriculture (USDA) and the National Oceanic and Atmospheric Administration (NOAA).
Current drought data
Abnormally dry
Drought - moderate
Drought - severe
Drought - extreme
Drought - exceptional
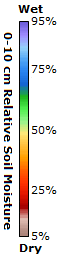
Shallow Soil Moisture overlay:
Toggle this button to add and remove soil moisture information from the map. The Shallow Soil Moisture overlay displays the estimated relative moisture content (%) of the upper 10cm of soil. Data is from the National Aeronautics and Space Administration (NASA). The overlay is updated daily from the NLDAS-NOAH Land Surface model.
Default map areas:
LCRA's Hydromet system allows you to select one of eight map locations to highlight. The maps range from the upper northeast region near Abilene to the Highland Lakes area to the City of Austin and down to the Gulf Coast at Matagorda Bay.
Gauge data list:
LCRA's Hydromet system allows visitors to obtain detailed information for any of its gauges throughout the Lower Colorado River basin. Select the type of Hydromet data to display in the drop down above, and then select a specific gauge to obtain the most detailed Hydromet information.
Refresh for the latest Hydromet gauge data. The page also automatically retrieves new data every 10 minutes.
Save the current map view and the Hydromet data displayed. This map view and Hydromet data will be displayed the next time you return to this page.
Clear the current map view and the Hydromet data displayed. The default map view and Hydromet data will be displayed the next time you return to this page.
Share the current map view and the Hydromet data displayed. A url representing this map view and Hydromet data will be copied to the clipboard to be shared with others.
Zoom To Location:
Pressing this button will zoom and pan the map to your location.
* Data may be unreliable due to damage to gauge or other issues. Use with caution.
Map url saved to the clipboard.
Map state cleared.
Map state saved.
LCRA’s Hydromet is a system of more than 275 automated river and weather gauges throughout the lower Colorado River basin in Texas. In addition, the website displays gauges maintained by the City of Austin and USGS. The Hydromet provides near-real-time data* on streamflow, river stage, rainfall totals, temperature and humidity.
Navigate LCRA’s Hydromet by:
Selecting a Map View from the drop down menu or zooming in on a specific area.
Selecting the data you would like to see from the Hydromet Data drop-down menu.
You may add additional Map Layers, including current radar and drought conditions, and view historic data under the Links section.
*Data displayed is automatically retrieved and subject to revision.
LCRA’s Hydromet is a system of more than 275 automated river and weather gauges throughout the lower Colorado River basin in Texas. In addition, the website displays gauges maintained by the City of Austin and USGS. The Hydromet provides near-real-time data* on streamflow, river stage, rainfall totals, temperature and humidity.
Navigate LCRA’s Hydromet by:
Zooming in on a specific area.
Selecting the data you would like to see from the Hydromet Data drop-down menu.
You may add additional Map Layers, including current radar and drought conditions.
*Data displayed is automatically retrieved and subject to revision.